3.3. Sales Forecast & Turnover Planning
| Site: | FHM Online University |
| Course: | Company Foundation (MOVIDIS) |
| Book: | 3.3. Sales Forecast & Turnover Planning |
| Printed by: | , Gast |
| Date: | Saturday, 27 June 2026, 4:18 PM |
3.3.1. Supply and sales forecast
The market is defined by supply and demand. The performance of a company represents the supply (products and services) on the market. Demand is defined by the actual need of customers for services. Sales are the quantity of services that can actually be sold in a certain period of time. This can mean hourly, daily, weekly, monthly or annual sales. Sales represent the service that can be sold.
The sales forecast is the strategic core of a business plan. It decides with which range of services the company wants to enter the market. The sales forecast therefore contains the entrepreneur's prediction and decision as to the extent and period of time in which his offer should find a demand. It is based on the market and competition analysis. While the market and customer potential tries to capture the qualitative and quantitative size of the market segment, the sales forecast is to determine the actual service offer - as worked out in the market matrix.
The assessment of demand is the most important entrepreneurial decision because it is the assumption about the economic success of the company. The sales forecast lays the economic foundation for the business concept. It decides on growth, consolidation or reduction. With the determination of the sales volume, the revenues or proceeds and thus the turnover are determined.
|
Note: With the justification of the sales forecast, the turnover of the business is at stake. The manner of justification and the arguments presented must be plausible, comprehensible and realistic. |
In reality, sales forecasting is the greatest entrepreneurial challenge. This is particularly difficult in the case of start-ups or new business projects that attempt to open up previously unknown markets or market sectors. But the annual sales forecast of small and medium-sized enterprises is also a prognostic challenge. Planning sales or customer demand is a matter that requires justification, even in known markets.
The sales forecast always contains assumptions that have a certain probability of occurring in reality. Of course, there are also assumptions that do not occur in reality despite the best needs analysis. However difficult it may seem, a sales forecast has the function of making the planning of entrepreneurial success more probable. Only with a sales forecast is it possible to confirm or reject the assumptions made in retrospect - in the sense of controlling. With increasing entrepreneurial experience, there is a probability that the sales forecast will achieve a high success rate.
Sales volumes
The calculation of the sales quantity is tied to various initial conditions. When a company is founded, the goods or services must be produced or purchased as initial stock. If these are products, there are usually upfront costs that must be "financed. The products or the goods must be available, the service offer must be developed and ready for the market so that it can be sold.
Depending on the type of service, the sales volume is expressed in numbers of units, in numbers of projects, in numbers of products or in numbers of individual services. The quantity is given as a quantitative measure, the value of the services is calculated in euros. The sales forecast, together with the calculation of the sales prices, also represents the turnover forecast in euros.
The sales volumes and thus the turnover result from the course of actual sales:
|
Sales is the sale of services, i.e. the quantity of services sold |
Sale of 500 pieces of product A |
|
Trade margin is the sales price in relation to the purchase or procurement price |
|
|
Stock is the quantity and value of services purchased less services sold |
|
Table 6: Sales volume
The basic principle is that a company's range of services should be such that it can always be produced or delivered. The stock level should not be higher than required by the economic process (sales). Excessive stocks deprive the company of "liquid funds". Stocks that are too low jeopardise the ability to sell or produce and may require expensive orders in order to be able to satisfy customer demands.
If services are produced, there are usually no stocks. The equivalent of this are resources in the form of employees, rooms, networks and the like, which must be employed, held in stock or engaged in order to be able to produce the service in a professional, timely and customer-oriented manner. In order to be able to produce services, inputs in the form of "provisions" are necessary.Sales forecast and sales curve
The sales forecast must develop an idea of how the possible course of sales (sales curve ) can take place. The assumptions made must be explained and justified in a business plan; only then is it possible to understand the assumptions and recognise them as plausible.
Possible arguments for the course of a sales curve:
- In the sales curve, the variables: Customer and product at time X the act of purchase. It is therefore necessary to determine how many customers buy how many products at time X.
- Basically, a separate sales curve and rationale must be developed for each product and service. In reality, each individual product has its own product life cycle.
- In the sales forecast it can be helpful to group goods and products into groups or specific units. The grouping should be justified and explained in the service description.
- There is a basic assumption to be made about the quantity of sales, defined by the type of product and the manner of service. Examples: Number of drinks in a restaurant per hour. Number of counselling cases in a month. Sales per customer in an hour, in a month, in a year. The basic assumptions can be based on industry comparisons.
- sales volume based on the capacities of the company. There are various dependencies here: More than the existing capacity cannot be sold. If a restaurant has 10 seats, at time X only these can be occupied. On the other hand, the capacity is not the same as the actual sales volume. The 10 seats can also simply stand empty if no customers come.
- Seasonal fluctuations throughout the year must be taken into account and planned for. Ice cream sales will decrease in winter and increase in summer.
- Structural and cyclical fluctuations are to be planned for in the course of the year. The energy debate in Germany has a positive impact on business around "energy", increasing sales are to be expected. The rising oil price has "negative" effects on the purchasing behaviour of oil products. If prices rise, sales will fall.
- Sales depend on investments in equipment, machinery and devices. Investments in machinery and also personnel are prerequisites for generating growth in a company.
The course of the sales or turnover curve shall be justified. The assumptions on which it is based must be explained. Why is the sales curve "linear"? Why does it rise and fall in the course of the year? Why does the sales volume increase by X percent in the second and third year? Why are there jumps in sales at certain points in time?
The sales curve can be based on considerations from series of figures over time.
|
|
|
Jan 04 |
Feb 04 |
Mar 04 |
Apr 04 |
May 04 |
Jun 04 |
Jul 04 |
Aug 04 |
Sep 04 |
Oct 04 |
Nov 04 |
Dec 04 |
Total p.a. |
|
Time series |
A |
1 |
2 |
3 |
4 |
5 |
6 |
7 |
8 |
9 |
10 |
11 |
12 |
78 |
|
Time series |
B |
2 |
4 |
8 |
16 |
32 |
64 |
128 |
256 |
512 |
1024 |
2048 |
4096 |
8190 |
|
Time series |
C |
1 |
1 |
1 |
1 |
1 |
1 |
1 |
1 |
1 |
1 |
1 |
1 |
12 |
|
Time series |
D |
1 |
2 |
4 |
8 |
16 |
32 |
32 |
32 |
32 |
32 |
64 |
64 |
319 |
|
Time series |
E |
0 |
1 |
4 |
6 |
3 |
6 |
8 |
2 |
3 |
6 |
8 |
12 |
59 |
|
Time series |
F |
3 |
3 |
3 |
32 |
40 |
30 |
35 |
30 |
30 |
35 |
50 |
120 |
411 |
|
Time series |
G |
12 |
12 |
12 |
60 |
80 |
80 |
30 |
30 |
30 |
12 |
12 |
2 |
372 |
|
Time series |
H |
10 |
10 |
50 |
50 |
50 |
35 |
10 |
10 |
10 |
50 |
50 |
10 |
345 |
|
Time series |
I |
12 |
10 |
8 |
7 |
6 |
6 |
7 |
5 |
4 |
3 |
2 |
2 |
72 |
Table 7: Sales curve
3.3.2. Sales planning
If sales are based on the quantity of turnover, turnover planning indicates the valued services in euros. The turnover, also called revenue or income of a company, is calculated by multiplying the services sold (products and services) by the sales price of the services in the exchange rate of the respective national currency.
If sales volumes can only be planned with some difficulty, the challenge of turnover planning lies in determining the selling price of the services. Basically, price determination is a much more difficult undertaking than is often assumed. The question is, what determines the price of a service? Is it the market price, i.e. the price that can be achieved in the market in competition? Is it a cost price, i.e. the price it costs to produce and sell the services? The price calculation is presented in the framework of costing. When calculating turnover in a business plan, one or more defined sales prices per product or service must be assumed.
The turnover planning should be as sound as possible. The figures - even if they are estimates - must be comprehensible. They are if they are justified on the basis of criteria.
It should be noted that sales revenue should not be confused with the profit of the enterprise. Profit is calculated by subtracting operating costs and other obligations, such as taxes, from sales revenue. In other words, turnover is the amount of products and services sold per unit of time multiplied by the respective current monetary value.
The presentation of the turnover planning can be done graphically in different ways.
Presentation of the paragraph
The number series can be displayed as graphs. This has the advantage of giving a picture or a visual idea of the course of sales over the course of the year. Then it can be justified that there is a continuous increase without fluctuations or that there are sales fluctuations in winter and summer due to the weather or holidays.
The way sales are determined is a question of the type and quality of the product or service. The presentation and calculation has industry-specific characteristics. The specification of quantities is just as possible as the specification in groups, clusters, units of measurement (litres, weight, volume, area), type classes, orders or projects.
The presentation of sales makes a statement about the marketability of the business idea. Its correctness is rewarded with business success.
In the business plan, graphical representations should be explained, legends should have a drawing explanation. The sales volumes and time series should be justified in terms of content.
|
Example: The sales forecast gives the sales quantity of products (e.g. numbers of units) in a one-year period on
|
|
|
|
|
Jan. 04 |
Feb. 04 |
Mrz. 04 |
Apr. 04 |
Mai. 04 |
Jun. 04 |
Jul. 04 |
Aug. 04 |
Sep. 04 |
Okt. 04 |
Nov. 04 |
Dez. 04 |
Summe p.a. |
|---|---|---|---|---|---|---|---|---|---|---|---|---|---|---|
|
Produkt |
1 |
30 |
22 |
45 |
35 |
23 |
22 |
27 |
33 |
40 |
33 |
22 |
18 |
351 |
|
Produkt |
2 |
22 |
0 |
12 |
76 |
78 |
80 |
95 |
99 |
105 |
107 |
113 |
116 |
905 |
|
Produkt |
3 |
0 |
4 |
1 |
7 |
9 |
2 |
15 |
20 |
2 |
0 |
12 |
8 |
83 |
|
Produkt |
4 |
? |
|
|
|
|
|
|
|
|
|
|
|
|
Curves from series 1 - 3
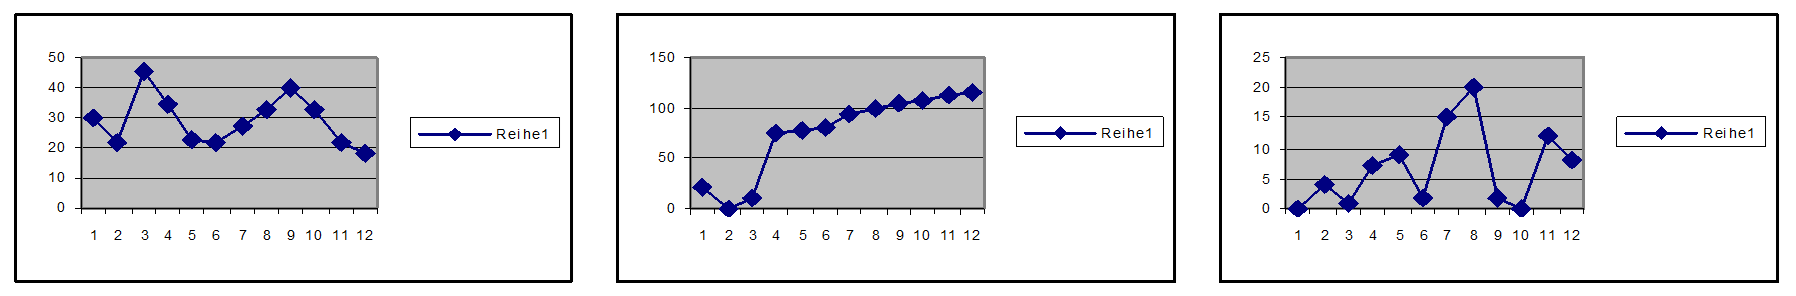
Product comparison over time
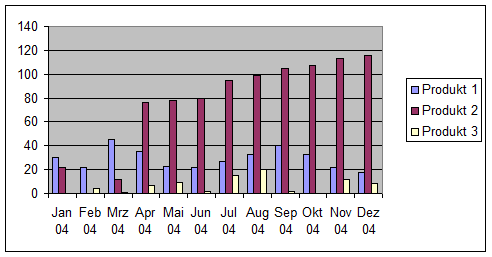
Products per group over time
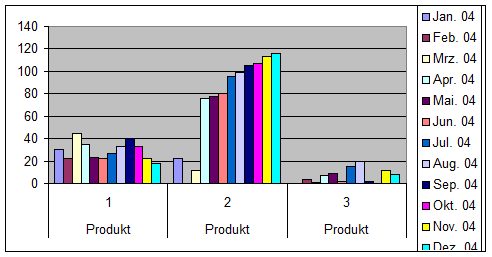
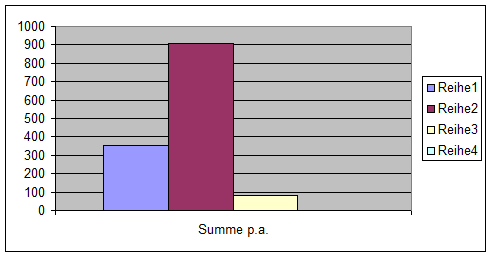
Product totals
Checklist for your business plan: Sales Forecast & Turnover Planning
How many products and services do you want to sell?
How high is the sales volume, how high is the turnover?
How realistic are sales and turnover forecasts?
Make relevant statements for your company on sales/turnover planning!
- How many services can you sell in the hour, the day, the week, the month, the year, in three years. Try to forecast sales as realistically as possible.
- Define the sales quantities.
- Define capacity utilisation.
- Calculate the turnover based on the sales forecast.
- How high is the risk? Best and worst case. Try a percentage assessment of the risk?