3.3. Sales Forecast & Turnover Planning
3.3. Sales Forecast & Turnover Planning
3.3.2. Sales planning
Presentation of the paragraph
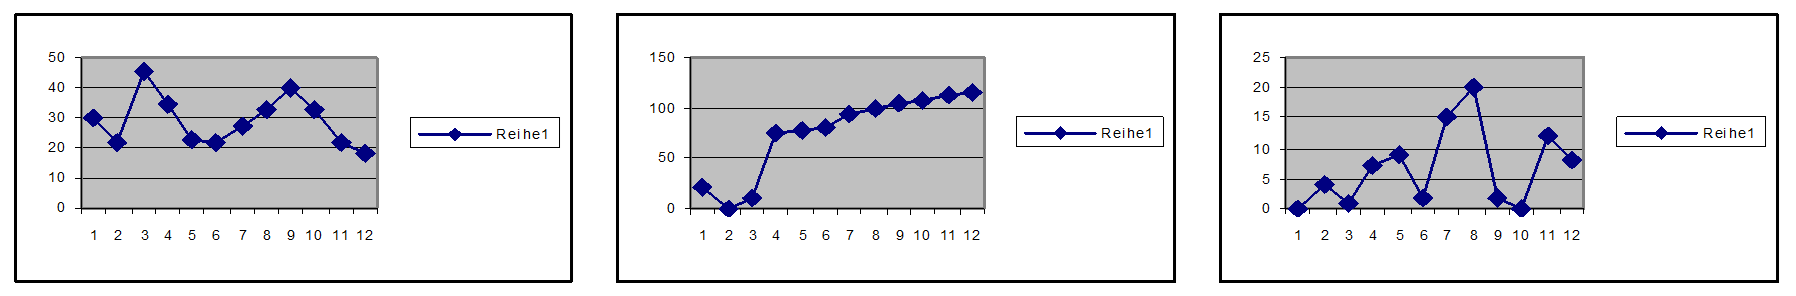
The number series can be displayed as graphs. This has the advantage of giving a picture or a visual idea of the course of sales over the course of the year. Then it can be justified that there is a continuous increase without fluctuations or that there are sales fluctuations in winter and summer due to the weather or holidays.
The way sales are determined is a question of the type and quality of the product or service. The presentation and calculation has industry-specific characteristics. The specification of quantities is just as possible as the specification in groups, clusters, units of measurement (litres, weight, volume, area), type classes, orders or projects.
The presentation of sales makes a statement about the marketability of the business idea. Its correctness is rewarded with business success.
In the business plan, graphical representations should be explained, legends should have a drawing explanation. The sales volumes and time series should be justified in terms of content.
|
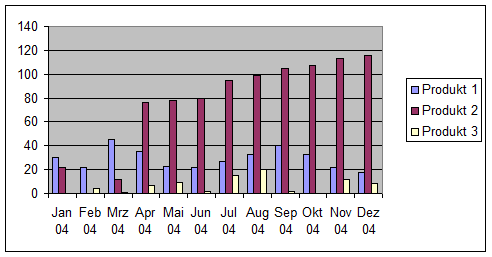
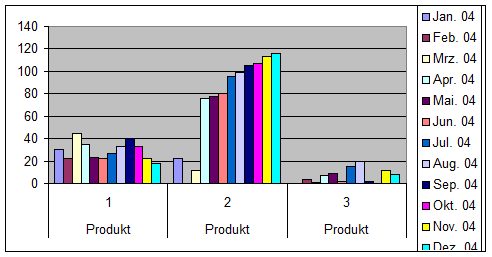
Example: The sales forecast gives the sales quantity of products (e.g. numbers of units) in a one-year period on
|
|
|
|
|
Jan. 04 |
Feb. 04 |
Mrz. 04 |
Apr. 04 |
Mai. 04 |
Jun. 04 |
Jul. 04 |
Aug. 04 |
Sep. 04 |
Okt. 04 |
Nov. 04 |
Dez. 04 |
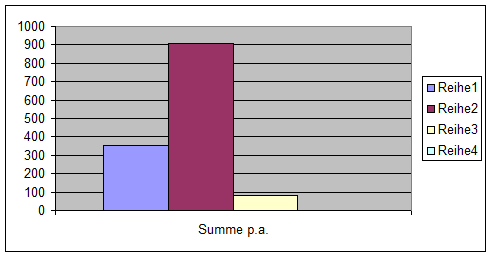
Summe p.a. |
|---|---|---|---|---|---|---|---|---|---|---|---|---|---|---|
|
Produkt |
1 |
30 |
22 |
45 |
35 |
23 |
22 |
27 |
33 |
40 |
33 |
22 |
18 |
351 |
|
Produkt |
2 |
22 |
0 |
12 |
76 |
78 |
80 |
95 |
99 |
105 |
107 |
113 |
116 |
905 |
|
Produkt |
3 |
0 |
4 |
1 |
7 |
9 |
2 |
15 |
20 |
2 |
0 |
12 |
8 |
83 |
|
Produkt |
4 |
? |
|
|
|
|
|
|
|
|
|
|
|
|
Curves from series 1 - 3
Product comparison over time
Products per group over time
Product totals